This is a series of visual stories that explore the mechanism of dithering, a technique used in digital imaging to create the illusion of color depth. The mechanism are visualized through multiple sets of 3D objects and animations, built using Three.js and Anime.js.
The Part 1 of the series was selected as one of The Pudding Cup 2025 winners, out of close to 100 entries.
The project begin by understanding the mechanism of dithering and how it works. I read articles, watched videos, and experimented with different dithering techniques to gain a deeper understanding of the topic.
In this phase I summarized the research findings and developed a narrative that would guide the visual storytelling. I also created a storyboard to plan out the visuals and animations.
I designed the visual elements and animations using Three.js and Anime.js. For each step in my narrative, I designed the animations that would effectively illustrate the mechanism of dithering.
Finally, I build the interactive stories using Three.js for 3D rendering and object creation, and Anime.js to bring the visuals to life through smooth animation.
visualrambling.space is a collection of interactive visual stories that explore technical topics through engaging, animated visualizations. My goal with this project is to make complex concepts more accessible and enjoyable for a wider audience.
It has attracted over 70,000 visitors in the first six months since launching and continues to grow through shares on platforms like Hacker News, Reddit, and design communities.
Every story begins with a topic that genuinely interests me and offers strong potential for visual exploration.
Once I choose a topic, I dive into a wide range of materials to gather information, build understanding, and find the main story to highlight.
In this phase I develop the narrative, breaking complex ideas into simpler, more digestible parts while simultaneously thinking about how best to visualize them.
Finally, I build the interactive stories using Three.js for 3D rendering and object creation, and Anime.js to bring the visuals to life through smooth animation.
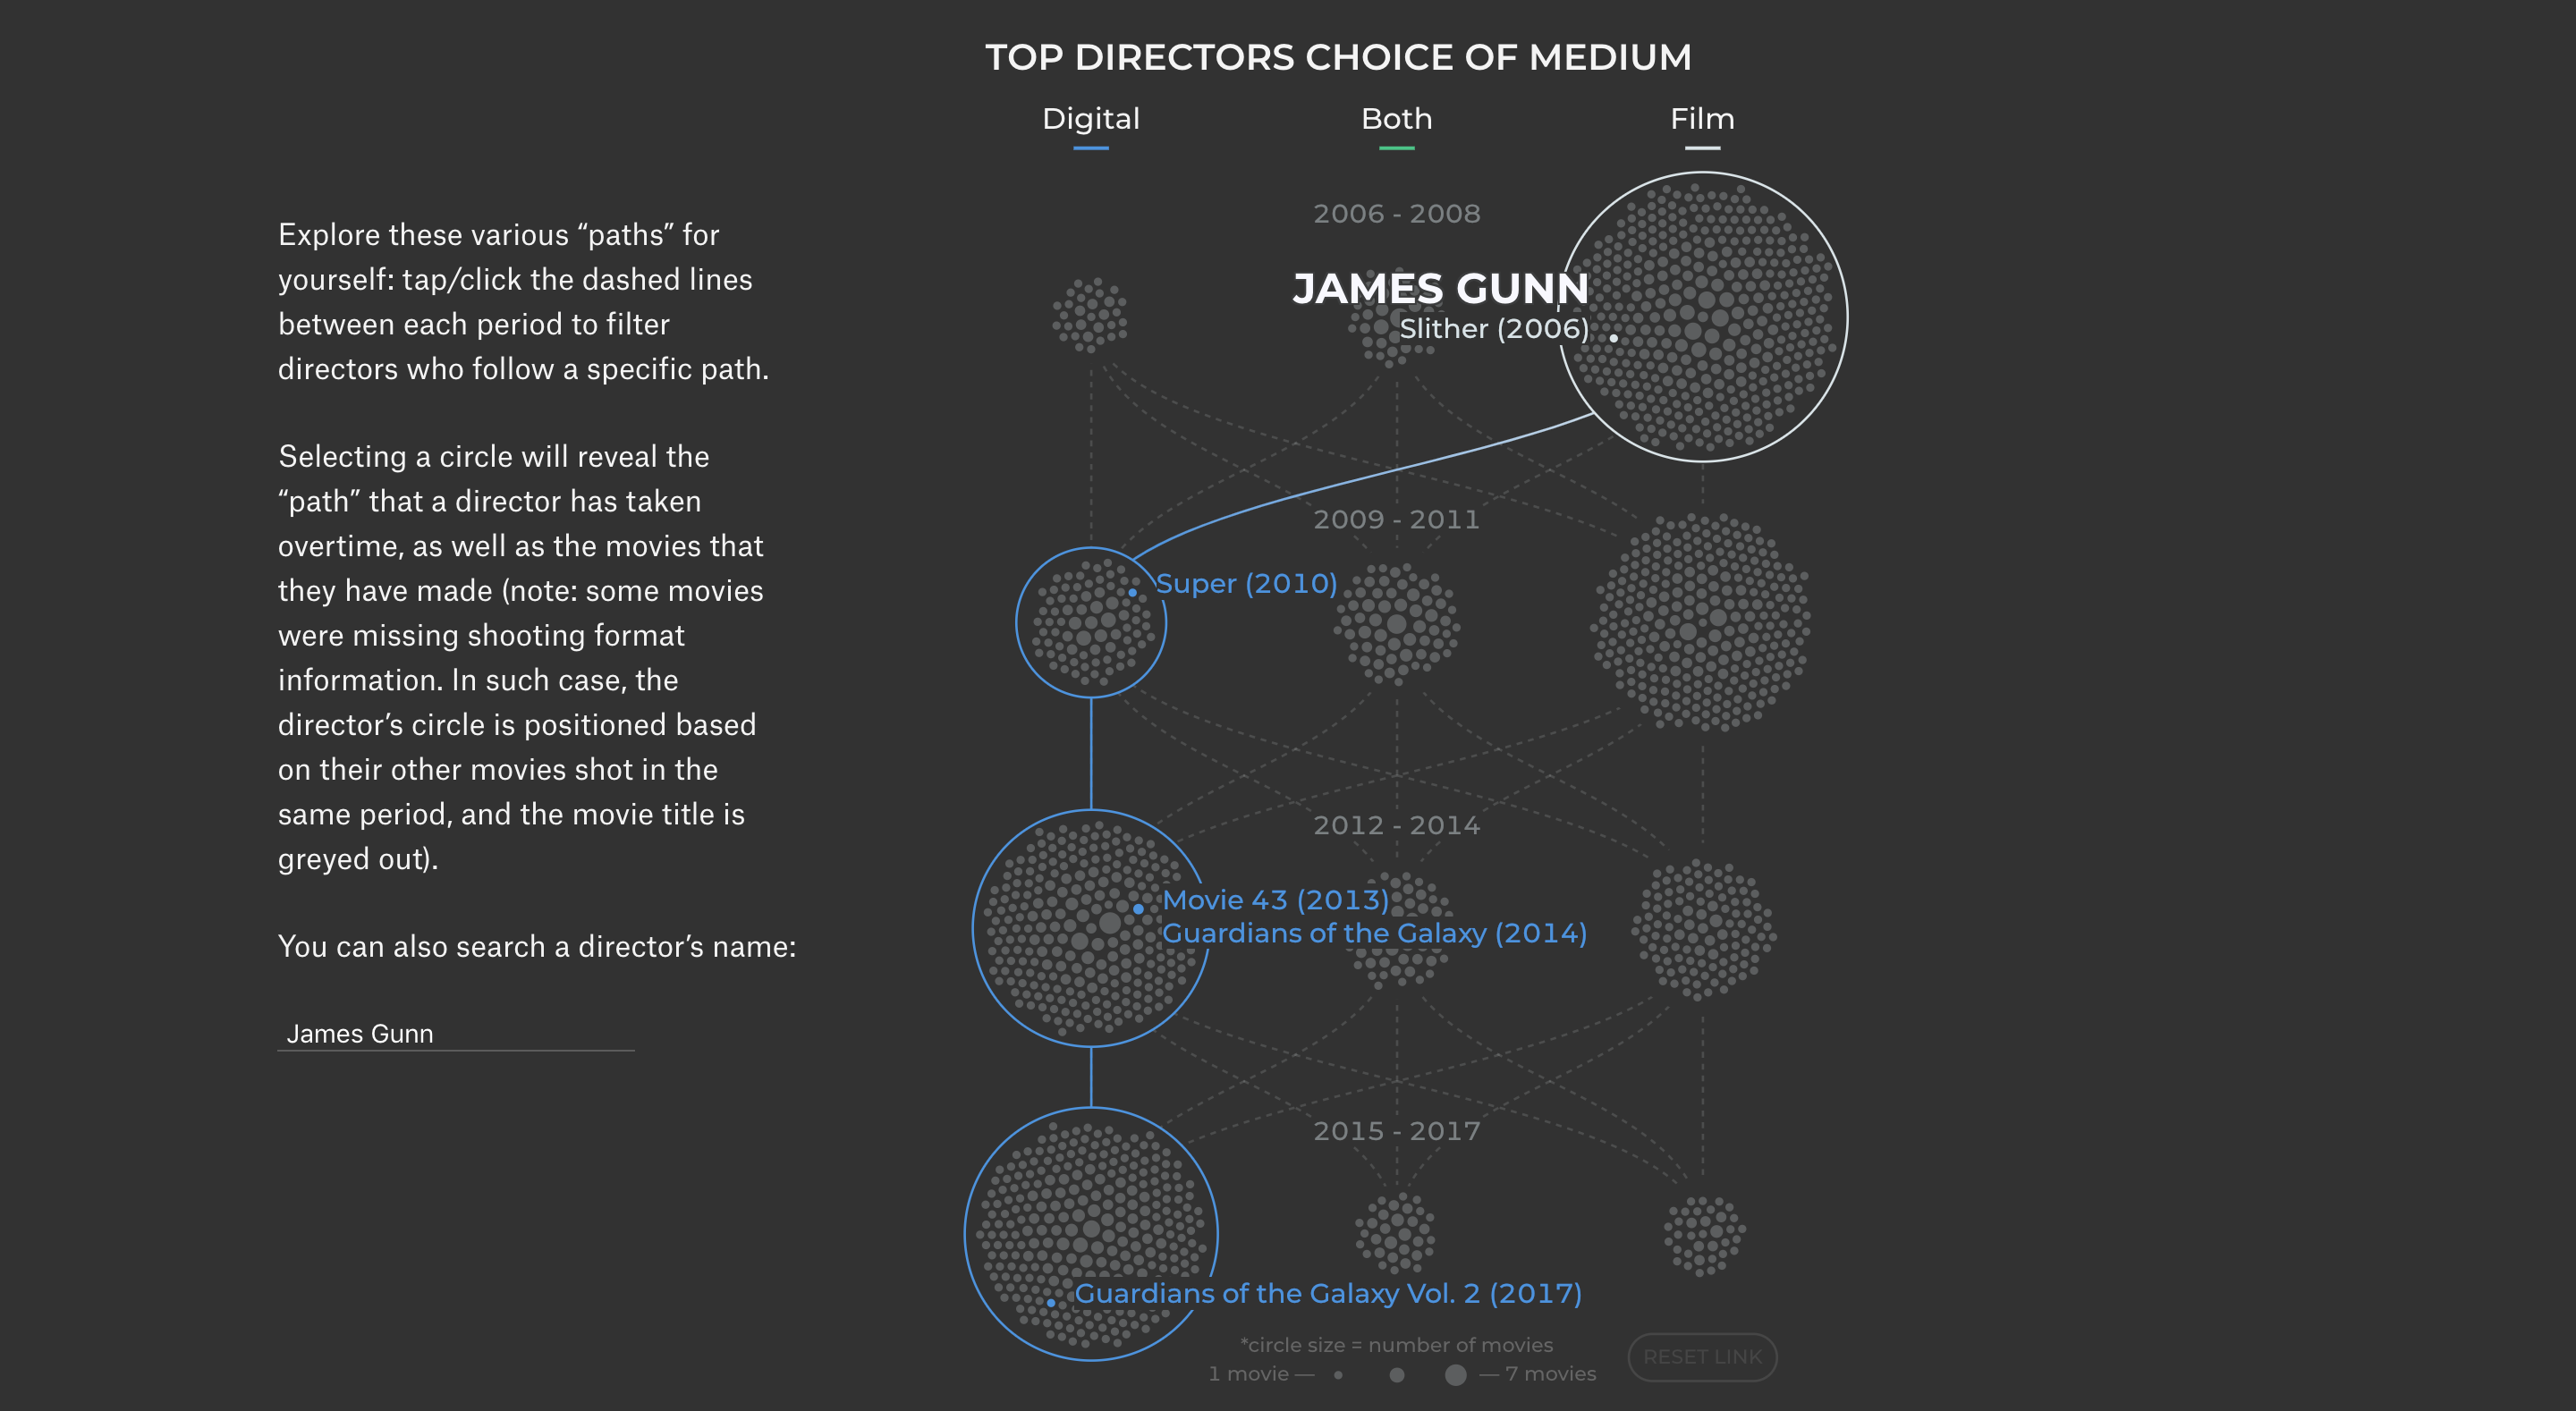
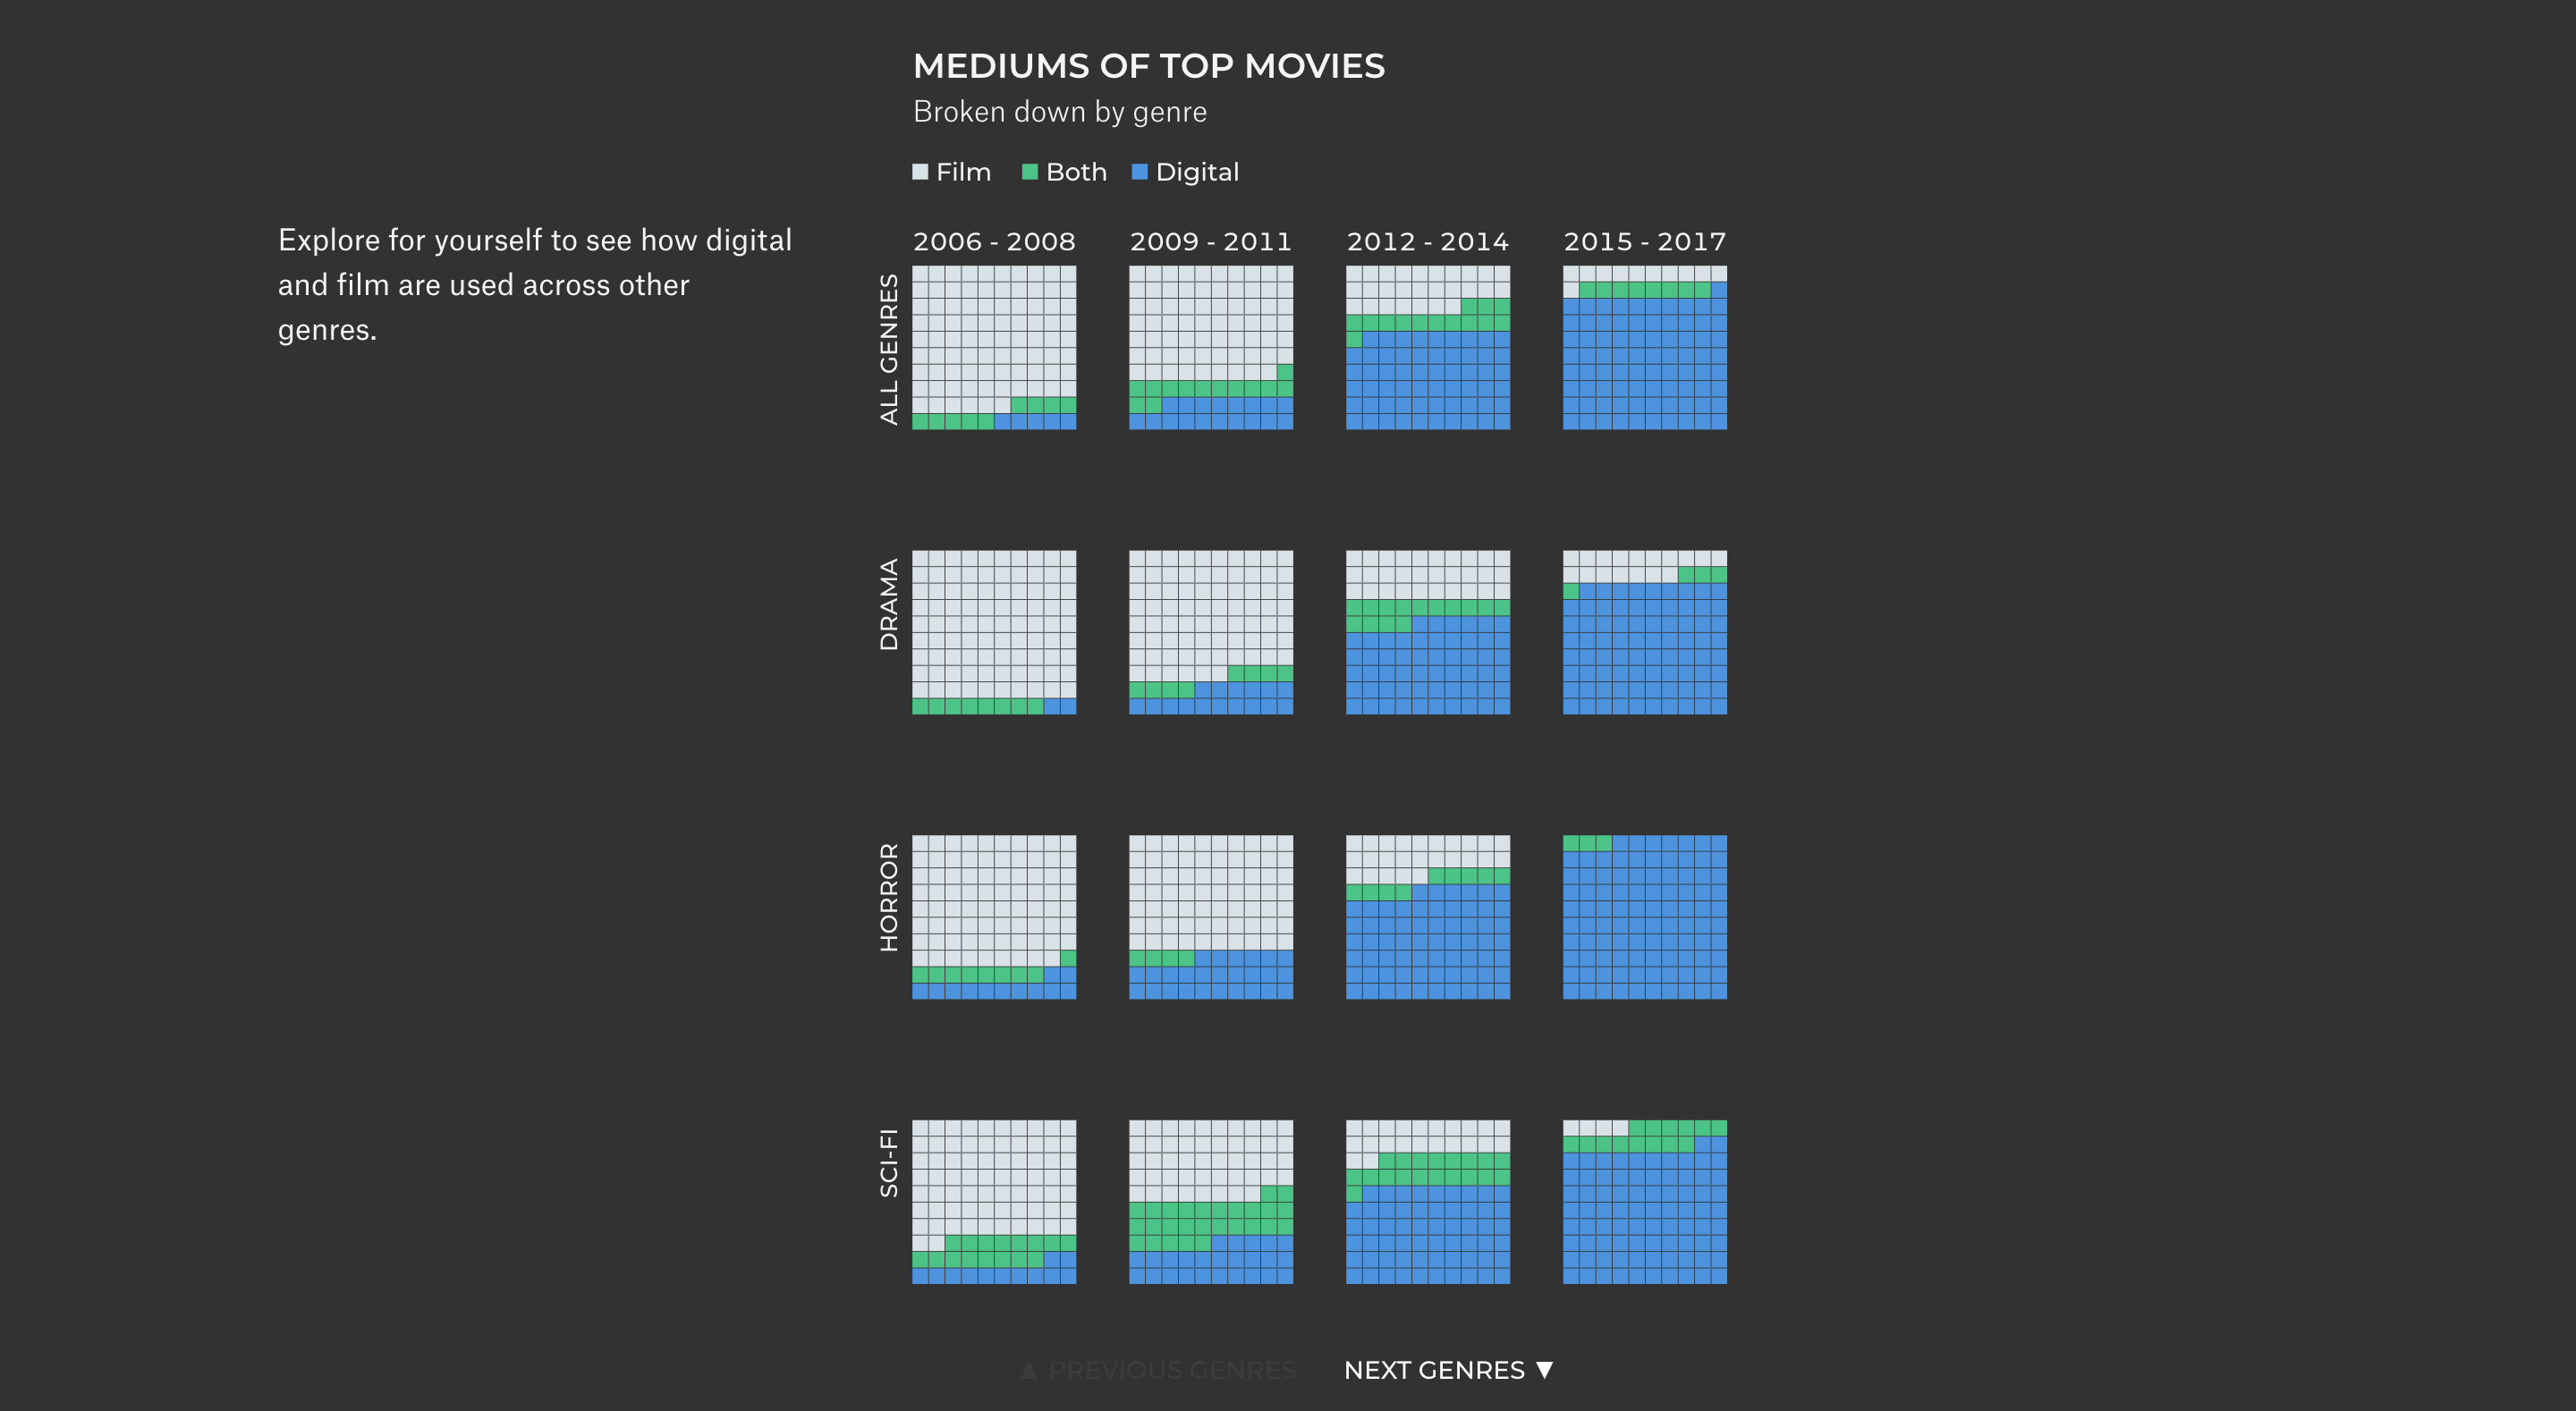
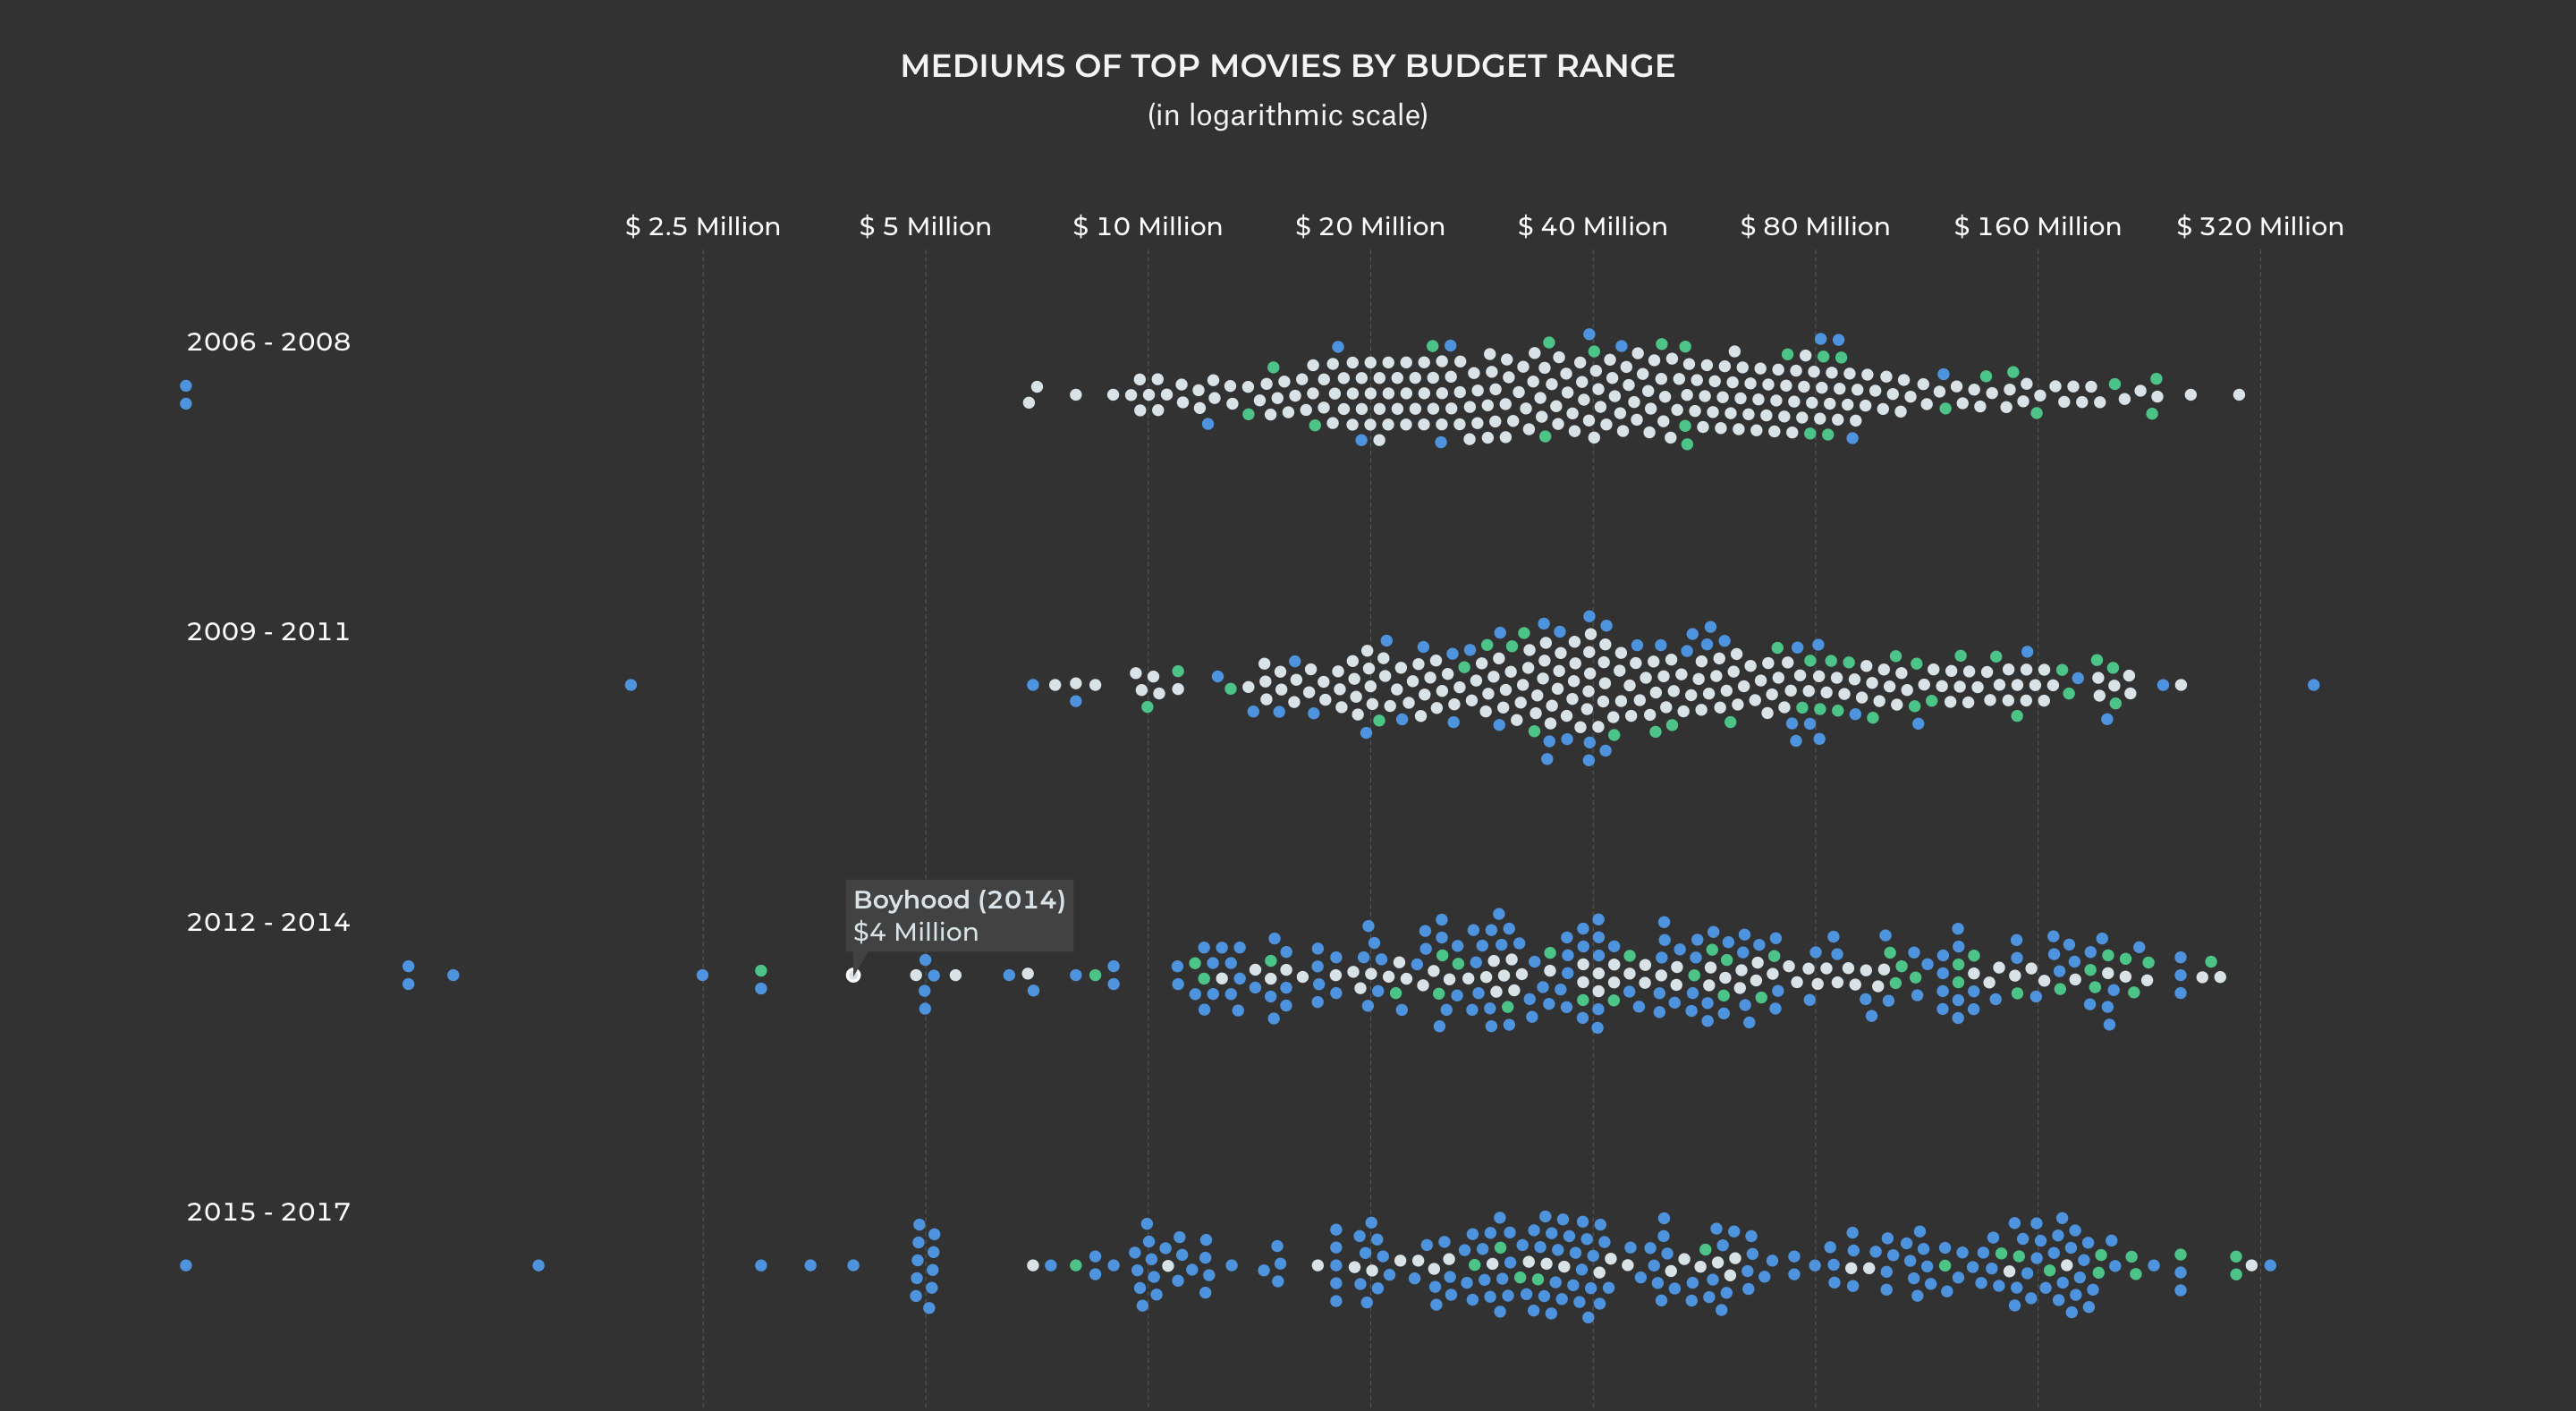
For this visual essay published by The Pudding, I analyzed IMDb data to investigate filmmakers' choices between film and digital shooting. I looked at when directors opted for one medium over the other, and whether those decisions correlated with movie genres or production budgets.
The Pudding team encouraged us to find a topic we were personally passionate about. I proposed exploring the long-standing film vs. digital debate in cinema.
I gathered raw data from IMDb and performed thorough cleaning and preparation.
With clean data in hand, I used SQL and Python to explore patterns and uncover interesting trends.
Next, I designed visualizations that would best support and enhance the story.
Finally, I built the interactive piece as a web page using D3.js and React.
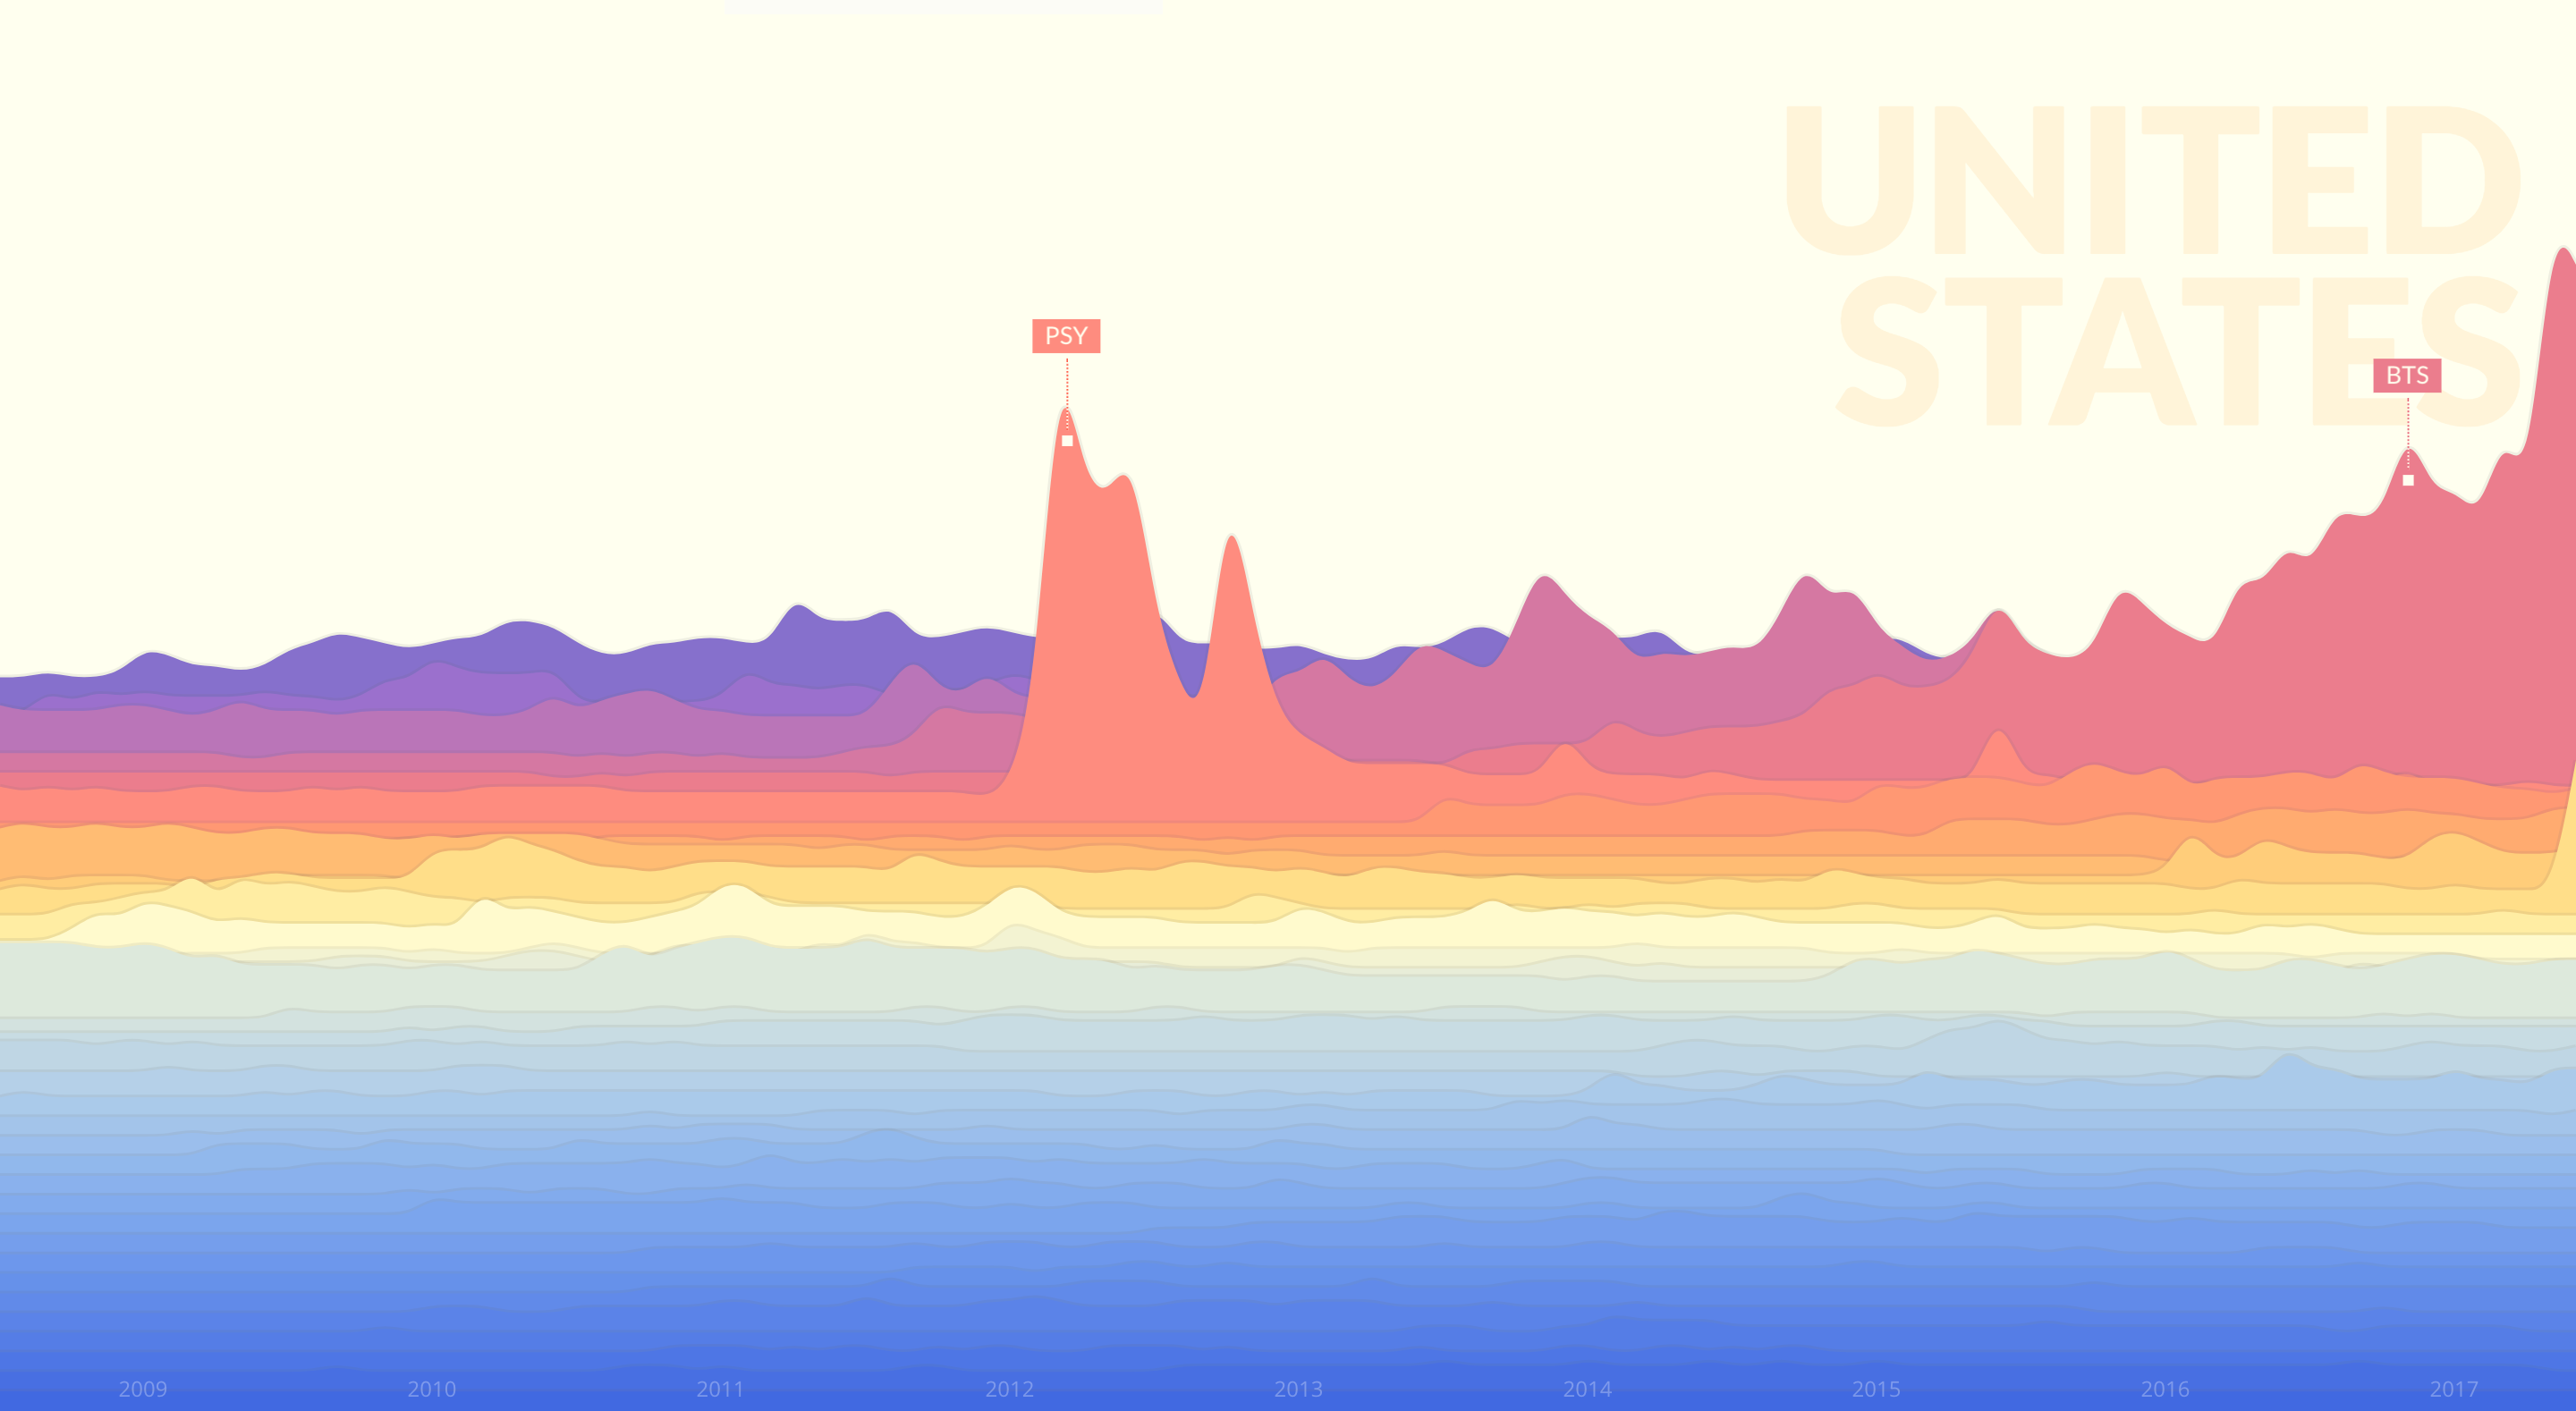
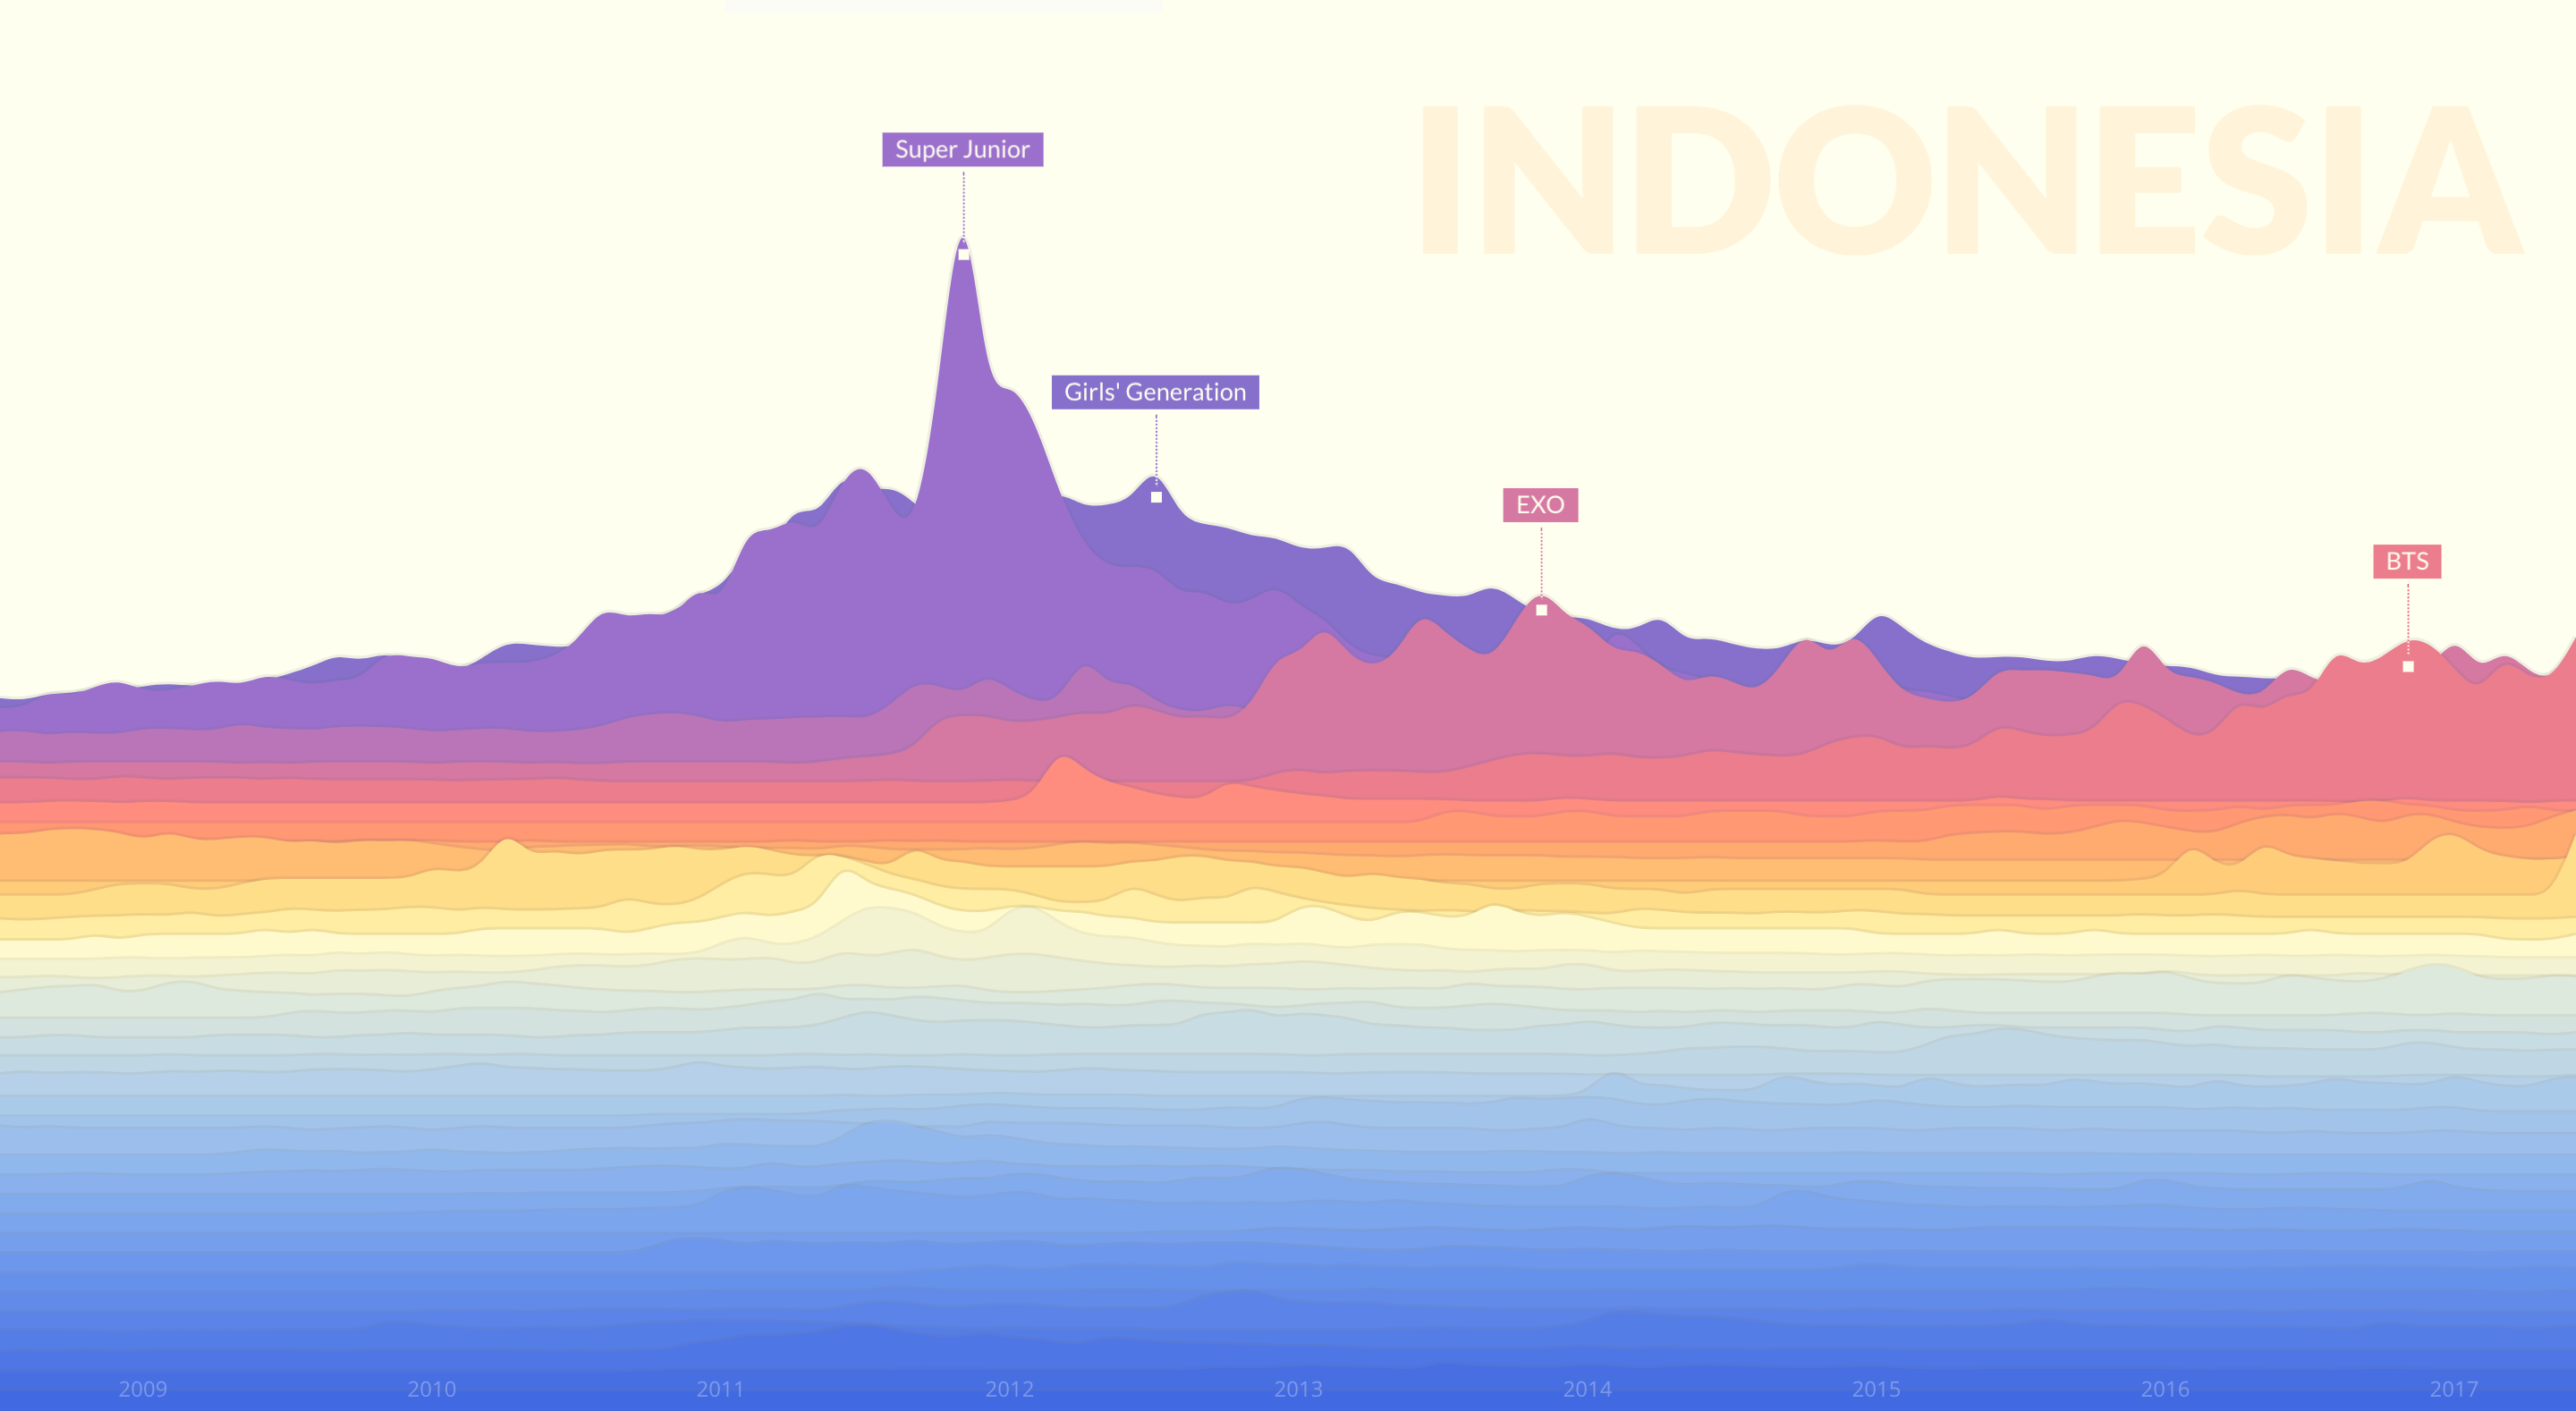
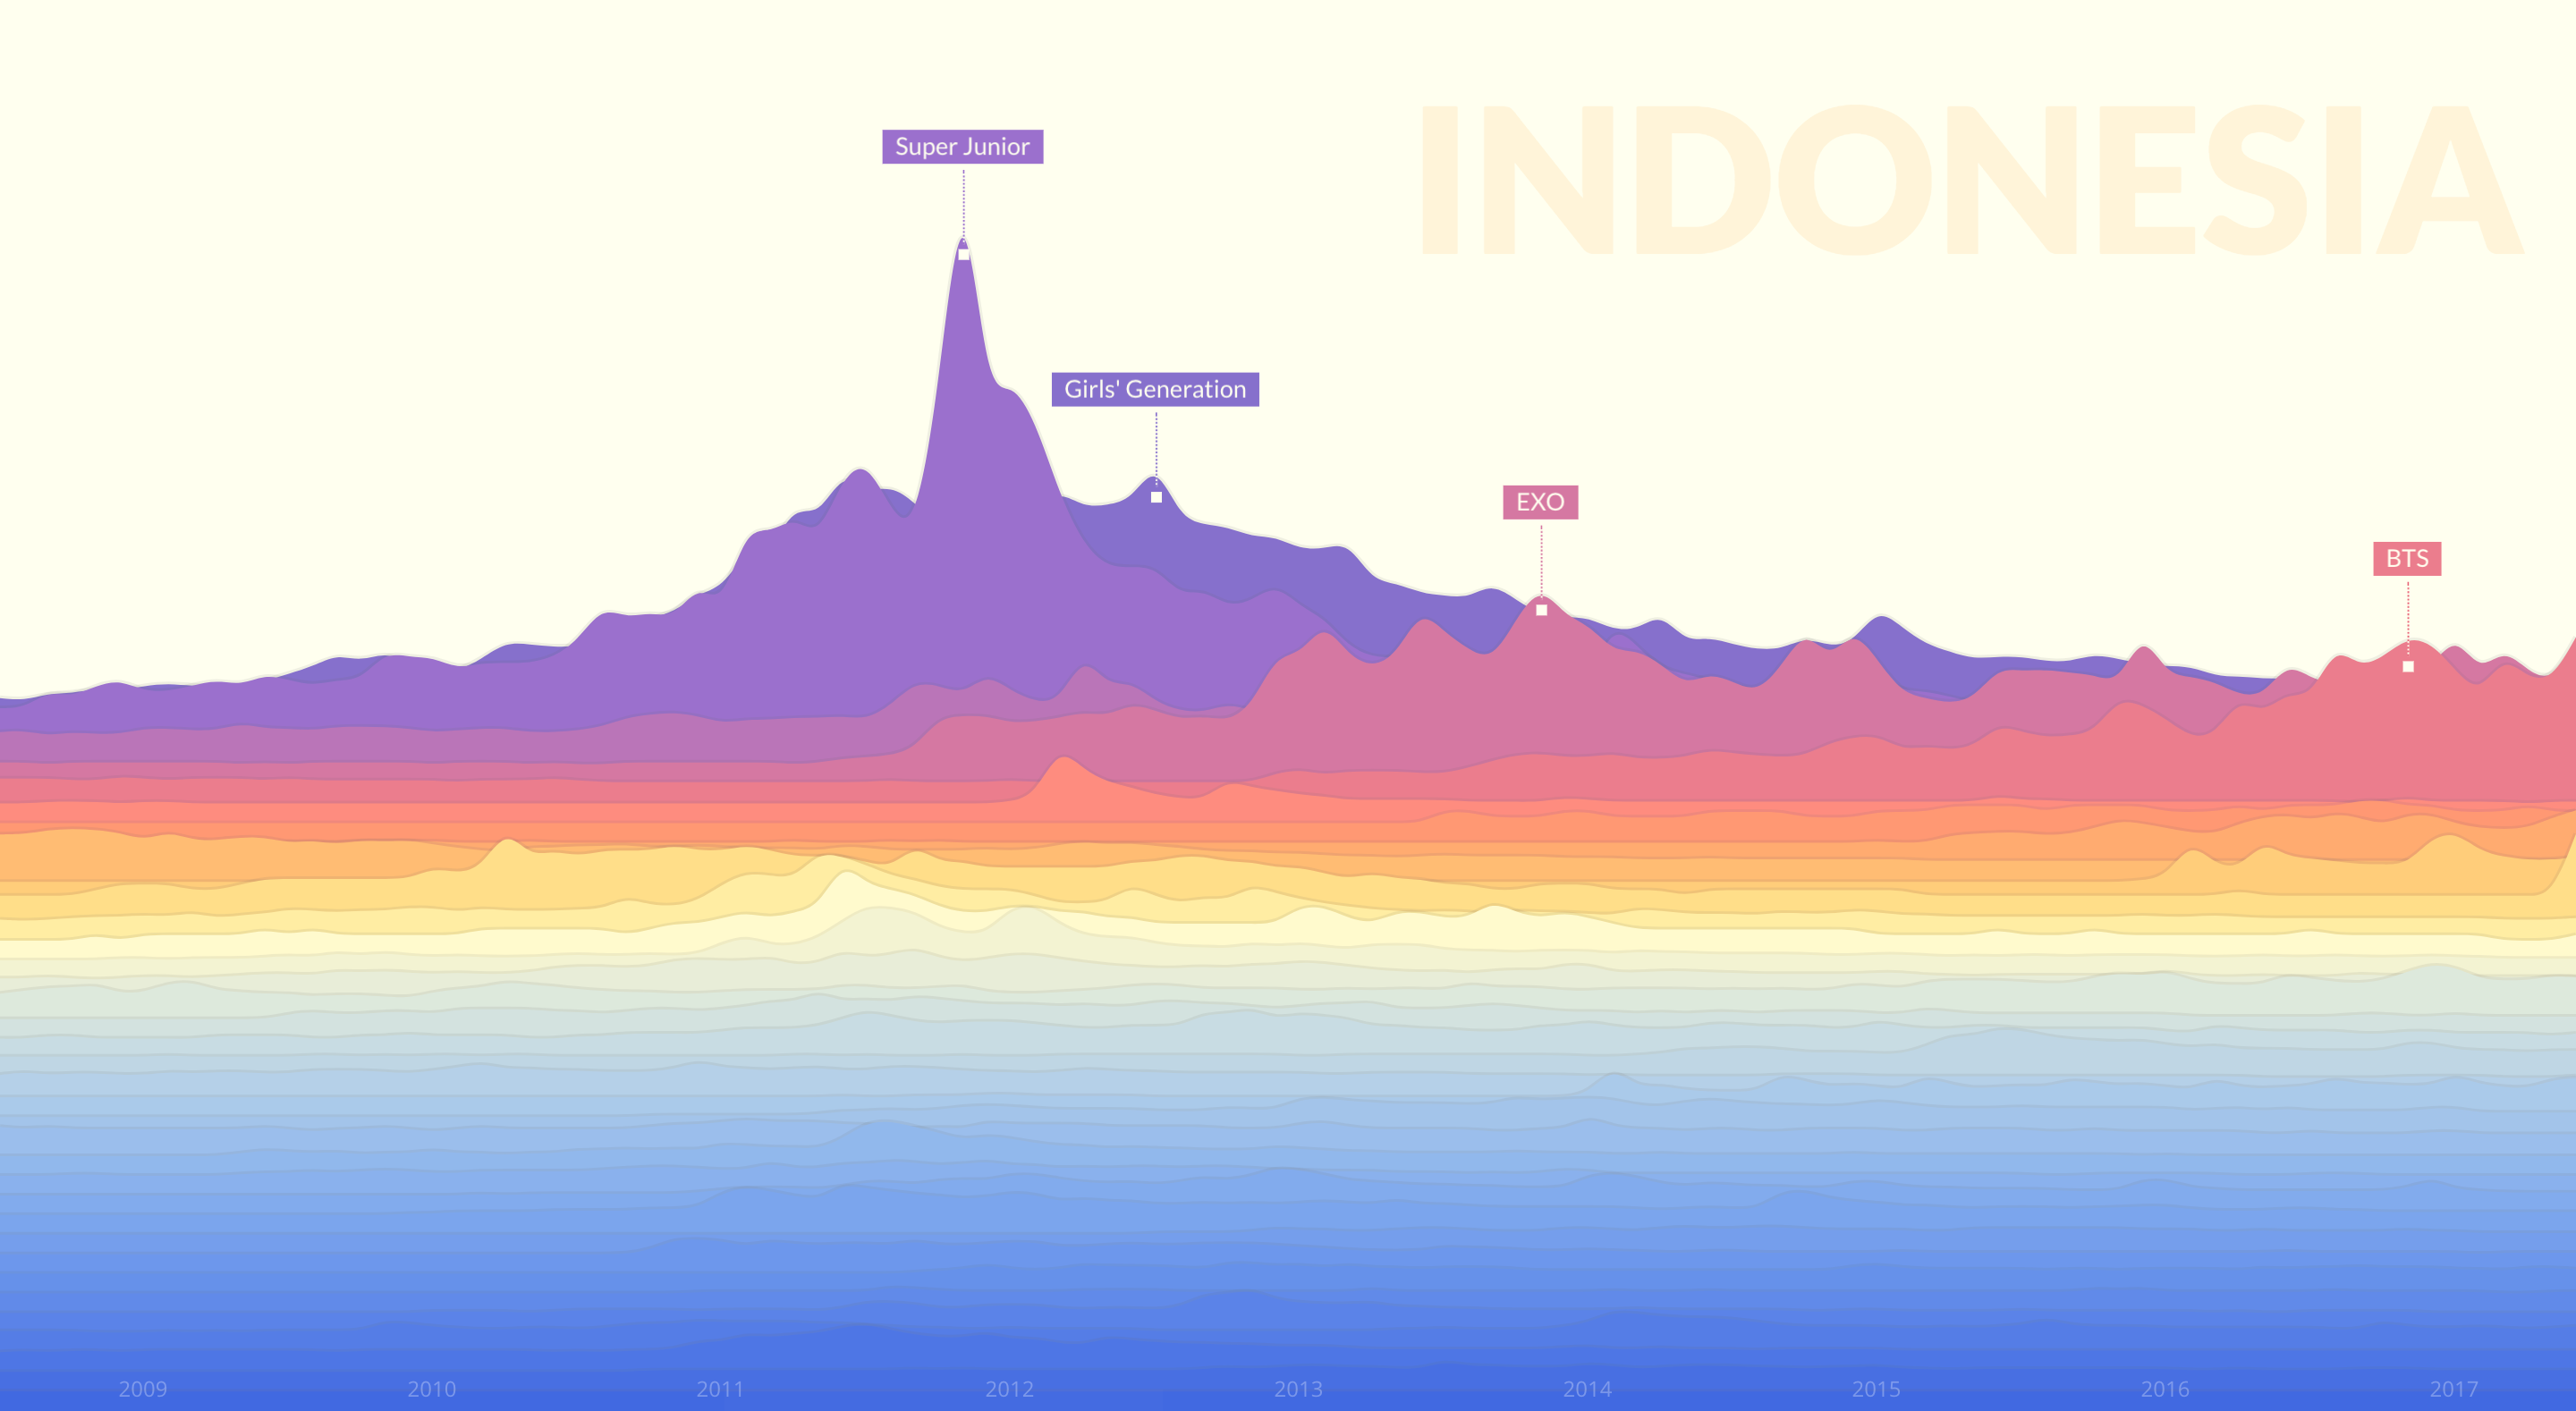
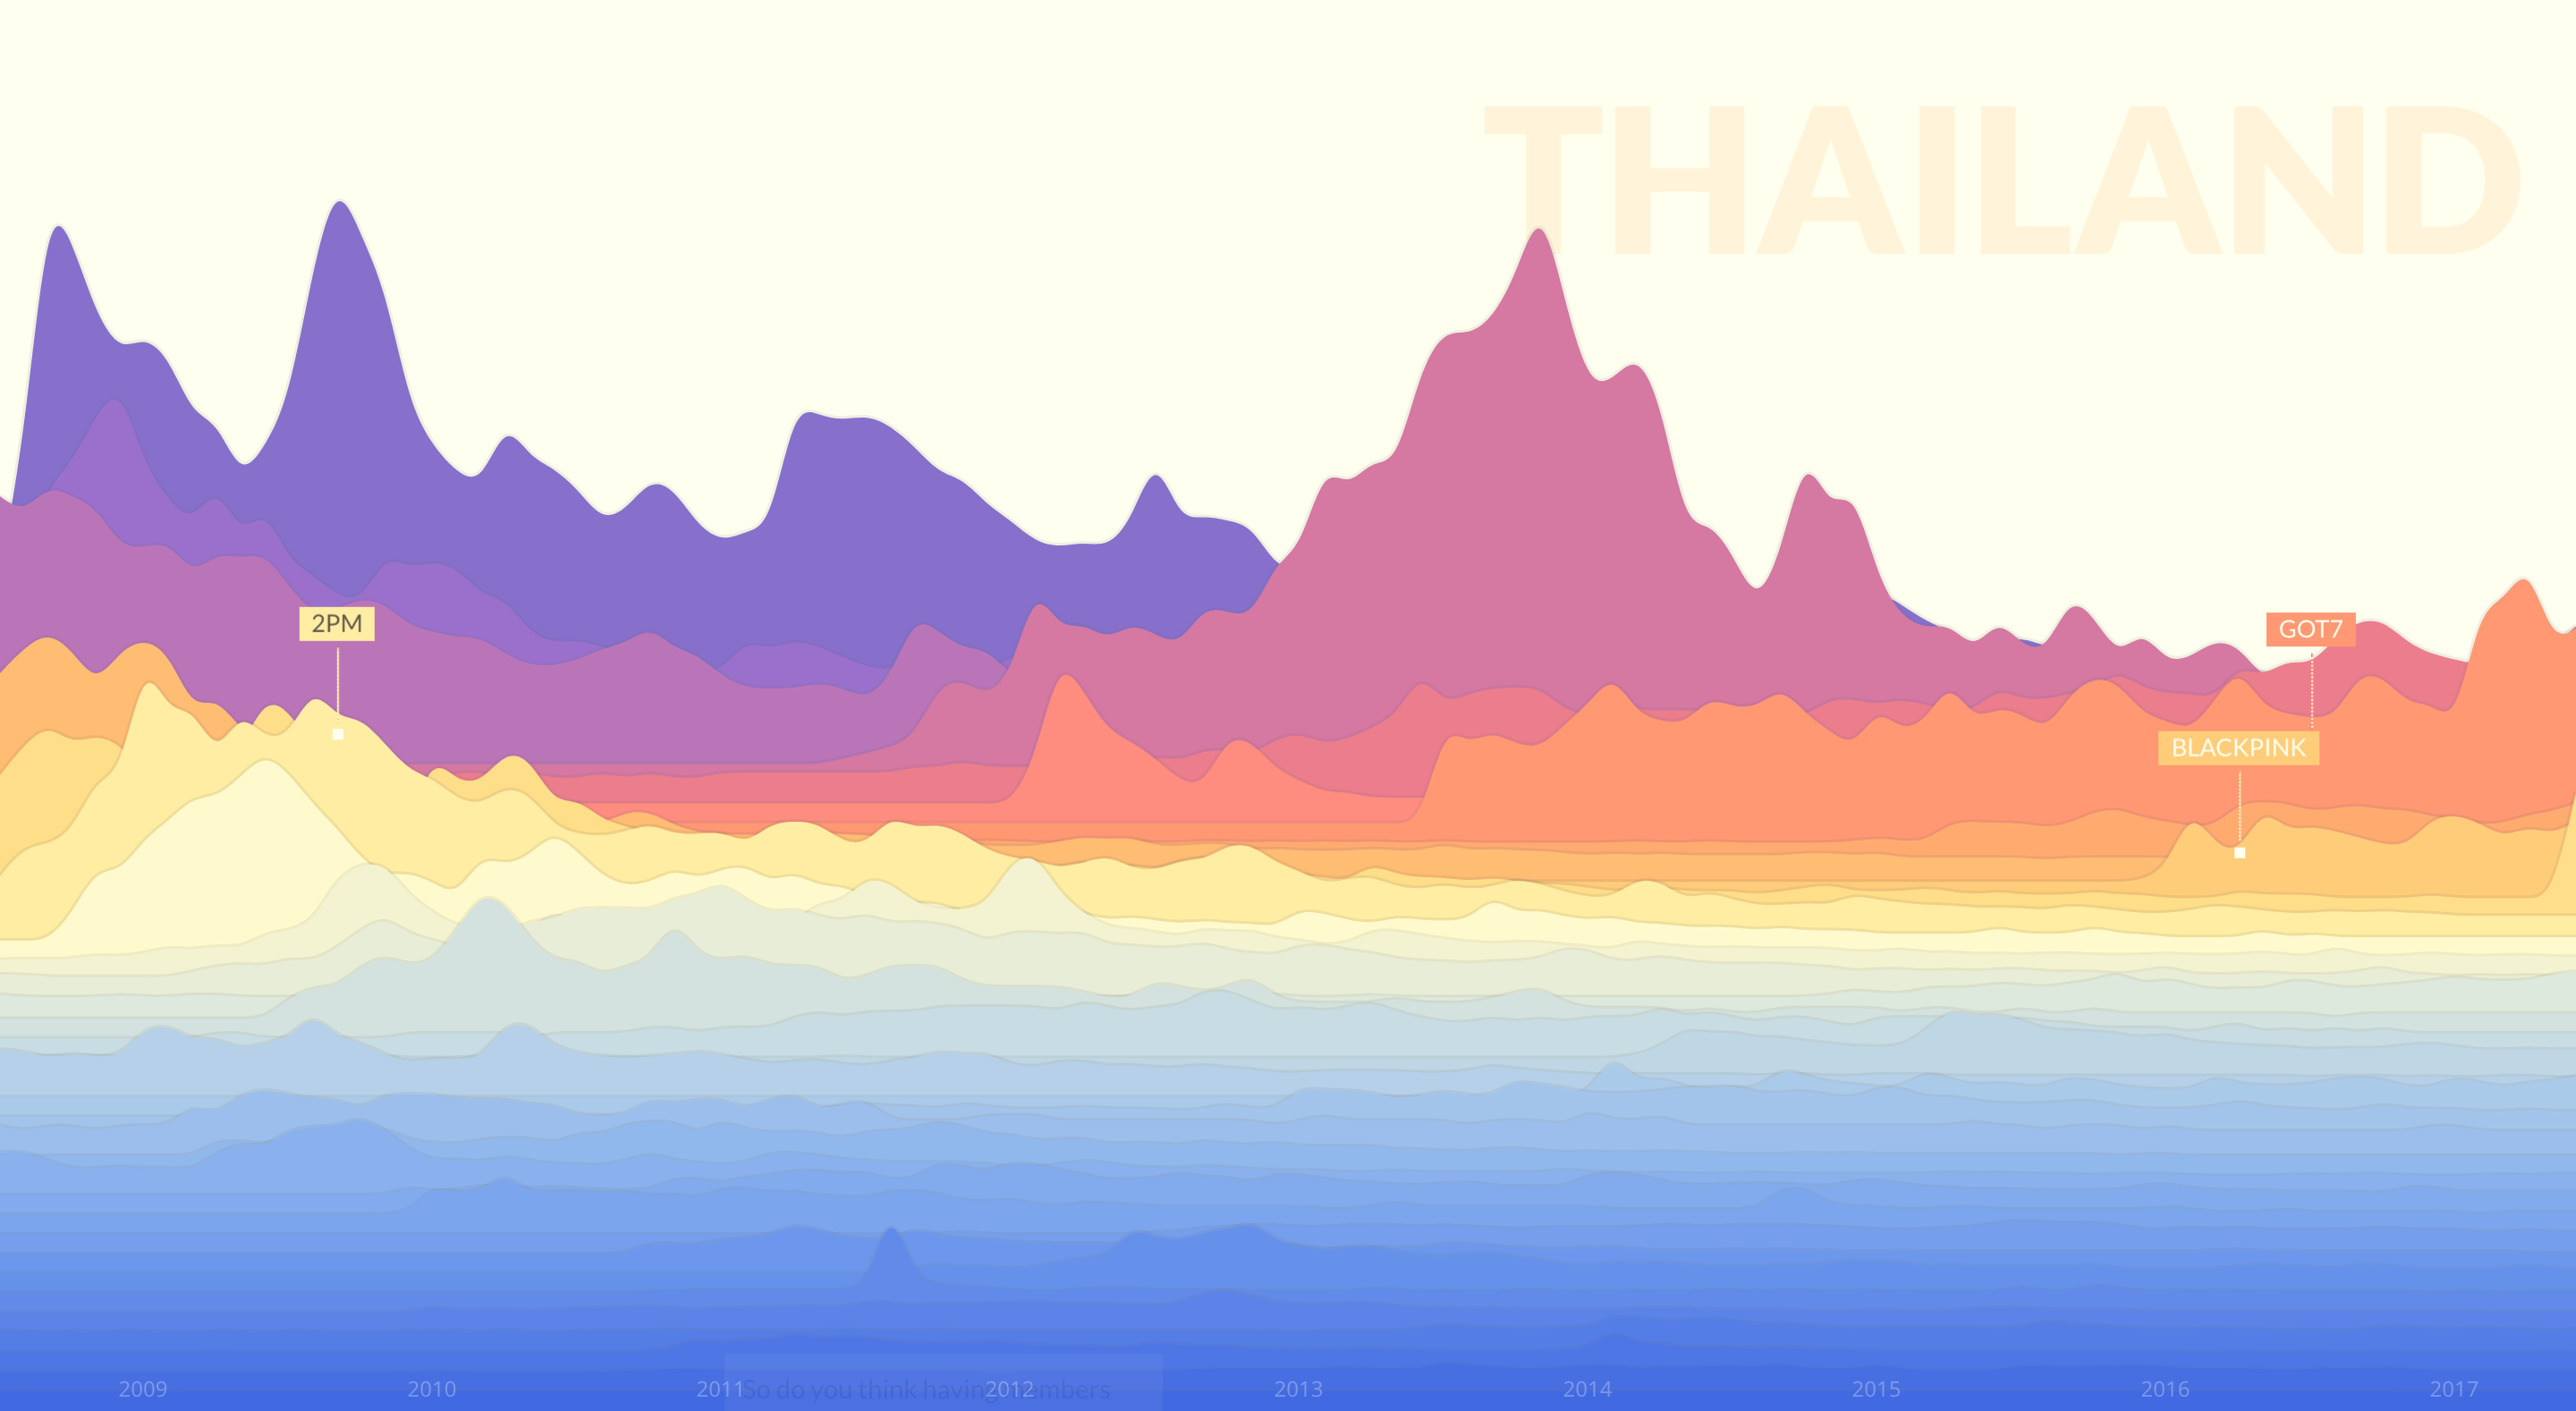
This personal project began when BTS exploded in popularity in the US around late 2017. Having followed K-Pop in Indonesia since around 2012, I became curious whether the "K-Pop wave" was rising differently across countries. That curiosity led me to analyze Google Trends data to find out.
I wrote Python scripts to pull Google Trends data for various K-Pop groups across multiple countries.
I visualized the initial data in Excel to compare trends, eventually selecting five countries with the most distinctive and interesting patterns: Indonesia, the US, China, Thailand, and Japan.
The biggest challenge was creating a clear, harmonious color palette for 35 different artists. I used chroma.js to help generate an effective color scale.
I built the interactive piece as a web page using D3.js and React.